
The Missing Observability Layer for Your LLM Command-Line Tools: Introducing cli-obs-proxy
If you’re a developer who loves working in the terminal, you’ve probably adopted command-line LLM tools to speed up your workflow. But if you’re like me, you don’t just stick to one provider. You juggle multiple providers (OpenAI, Anthropic, local models, etc.) depending on the task, cost, or model capability.
And that creates a massive blind spot: It is incredibly difficult to trace your usage per provider in one place.
Vendor dashboards only show you their slice of the pie. Custom wrapper scripts are fragile and require constant maintenance. You’re left guessing your total token consumption, costs, and which models you’re actually relying on.
I built cli-obs-proxy to solve this exact problem. It’s a lightweight, drop-in observability stack that watches the HTTP traffic your favorite LLM CLIs send to the network, parses the token usage, and renders it as a live, unified dashboard.
No need to change your workflow. Just observe it.
How It Works
Instead of forcing you to adopt a new CLI tool or modify your existing scripts, cli-obs-proxy sits quietly between your terminal and the internet. It’s built as a four-service Docker Compose stack:
Proxy (
mitmproxy): A Python add-on that intercepts HTTP/HTTPS traffic from wrapped CLI commands, recording metadata like latency, status, and payload size.Token Parser: Intelligently parses both standard JSON and SSE streaming responses from Anthropic and OpenAI, extracting
input_tokens,output_tokens, andtotal_tokens.Backend (NestJS + GraphQL): A cleanly layered API that serves recent metrics, call details, and per-model token aggregates.
Database (PostgreSQL): Persists all observations with optimized indexes on
observed_at,host, andmodel.Frontend (React + Recharts): A beautiful, live-updating dashboard showing a filterable request log, per-model token bar charts, 7-day usage trends, and a weekday heatmap.
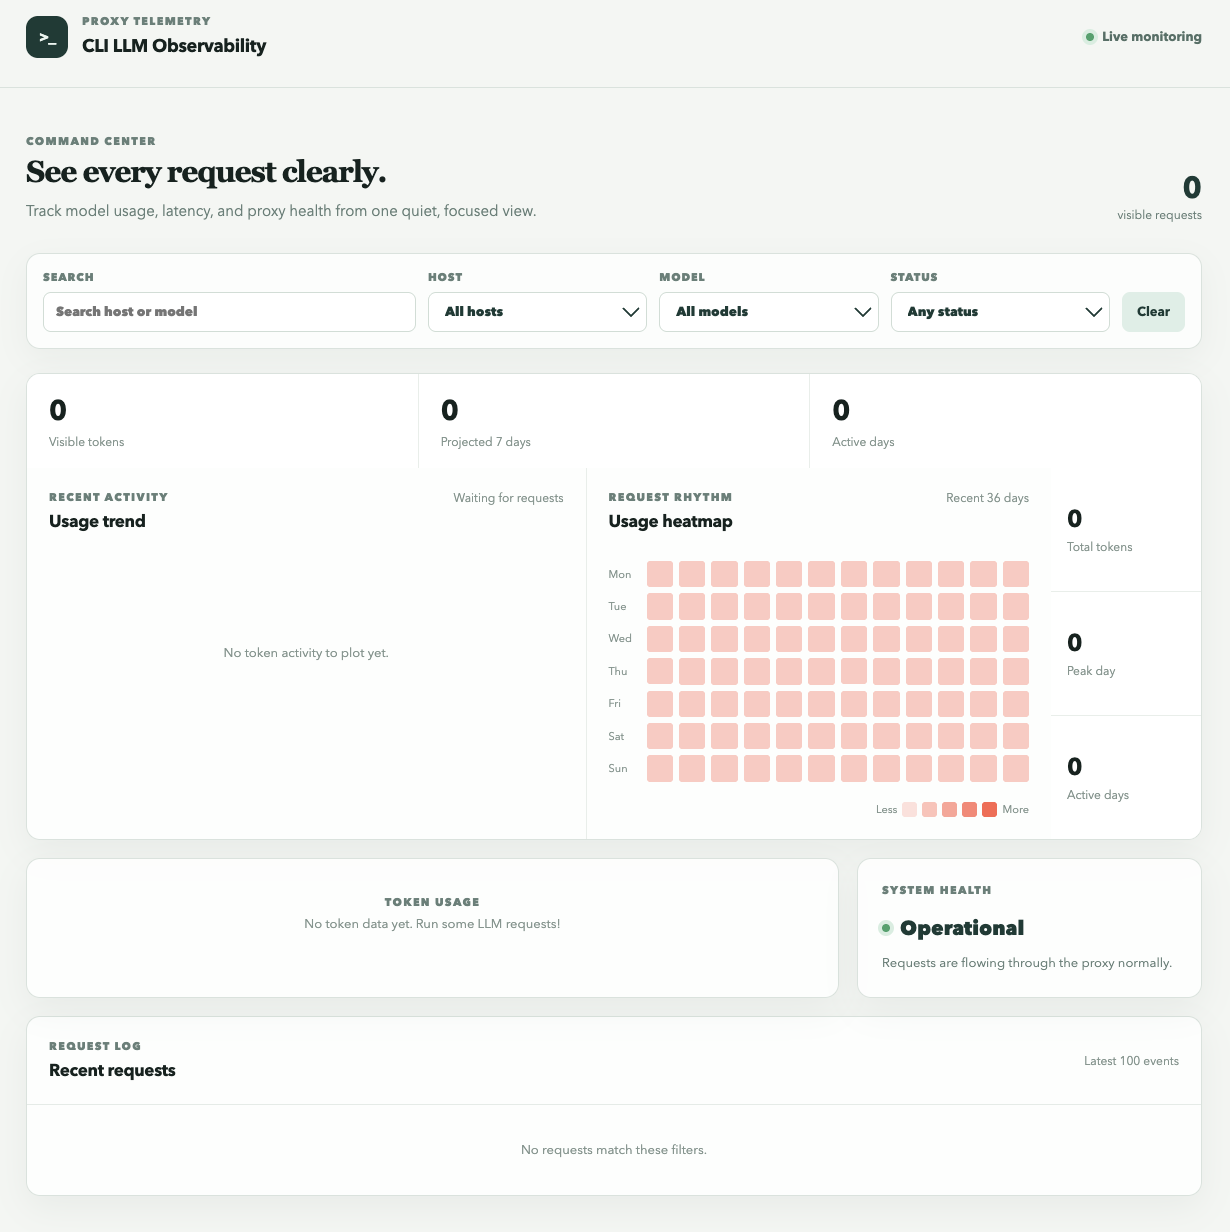
(A glimpse of the unified dashboard tracking per-model usage and trends)
Key Features
🔍 Unified Provider Tracking: See OpenAI, Anthropic, and other supported providers side-by-side in a single dashboard.
🌊 Streaming Support: Accurately parses token usage from Server-Sent Events (SSE) streaming responses, not just static JSON.
🕵️ Call Inspection: The newest calls retain request/response headers and bodies for on-demand debugging directly from the UI.
🐚 Drop-in Shell Wrapper: A simple
llmobsfunction routes any CLI through the proxy and automatically handlesNODE_EXTRA_CA_CERTSso Node-based tools (like Claude Code) trust the intercepted TLS.🐳 Zero-Friction Setup: Ships as a self-contained Docker Compose stack. Get up and running in seconds.
Quick Start
Getting started takes just a few minutes. The entire stack is containerized.
1. Spin up the stack
git clone https://github.com/Basiliskin/cli-obs-proxy.git
cd cli-obs-proxy
docker compose up -d --build
This launches the frontend (port 80), backend GraphQL API (port 3000), mitmproxy (port 8080), and PostgreSQL (port 5432).
2. Trust the Proxy CA (macOS)
Because the proxy decrypts HTTPS traffic to read token usage, you need to trust its CA certificate. The project includes a helper script for this:
# Copy the cert out of the Docker volume
VOLUME_NAME=$(docker volume ls -q | grep mitmproxy_certs)
docker run --rm -v "$VOLUME_NAME":/certs -v "$PWD":/local alpine \
  cp /certs/mitmproxy-ca-cert.pem /local/

# Trust it system-wide
security add-trusted-cert -d -r trustRoot \
  -k ~/Library/Keychains/login.keychain-db \
  ./mitmproxy-ca-cert.pem
(Linux/Windows users can follow the standard mitmproxy CA installation guides).
3. Wrap your CLI commands
Add the provided helper function to your ~/.zshrc or ~/.bashrc. Then, simply prefix any command with llmobs:
# Track a Claude CLI prompt
llmobs claude -p "Explain quantum entanglement simply"

# Track a raw curl request to OpenAI
llmobs curl https://api.openai.com/v1/chat/completions ...

# Pass flags to the underlying command using --
llmobs -- claude --some-specific-flag
The wrapper automatically sets HTTP_PROXY, HTTPS_PROXY, and NODE_EXTRA_CA_CERTS, ensuring your tools route through the observer without complaining about TLS certificates.
Why This Matters
When you use multiple LLM providers, observability is the key to cost control and workflow optimization.
With cli-obs-proxy, you can finally answer questions like:
"Am I accidentally burning through expensive output tokens on a model that doesn’t need them?"
"Which provider am I actually using the most this week?"
"Why did that specific CLI command fail or take 10 seconds? Let me check the intercepted response body."
It gives you back the visibility that vendor-locked dashboards take away, all without changing the CLI tools you already know and love.
What’s Next?
This is just the beginning. The architecture is designed to be extended. Want support for a new provider? Need a different visualization? The codebase is modular and welcoming to contributions.
👉 Check out the repository, star it, and give it a try:
github.com/Basiliskin/cli-obs-proxy
I’d love to hear your feedback, bug reports, or feature requests. Open an issue, send a PR, or just tell your terminal what you wish it would do — that’s the whole point of this project.